A Time of Plenty
My wife has never been able to hold an outside job because of illness. Nevertheless, before the recession of the 1990's, we had always been comfortable financially. We did not worry about paying our household bills. We had no need to borrow money to pay for our central heating, double glazing or house extension. We hired tradesmen to fix the house, resurface the drive and service our domestic appliances.
We could afford to visit friends and relatives whenever we wished. We could buy the clothes we needed. We could afford good food, drink and presents at Christmas. Our weekly supermarket bill alone came to more than the whole of what we now receive in State welfare. We never quite attained the income necessary to be able to go abroad on holiday, but we always managed to have a short holiday in the summer, staying in a small hotel or guest house. In the summer of 1985 we even went to Scotland for two weeks. We also had occasional trips to the coast and meals out.
I had a large business overdraft facility with the bank. I always paid all my business suppliers within their credit periods. I had credit cards, one of which had no spending limit. With these I bought air tickets and paid hotel bills on business trips. I was able to pay cash for a new car when we needed one, and had no concern about the cost of having it serviced by the car dealer.
I could buy whatever office furniture and equipment I required. I could afford the latest computer and communications equipment and had no worries about being able to replace it if it should fail. I subscribed to an electronic mailbox service and made extensive use of my telephone line both for keeping in touch with my contacts and for transmitting data.
An Unwelcome Change
But in the spring of 1991 all this changed. Demand for all my products, services and skills suddenly disappeared. I had no income. Soon I had exhausted all my capital on vain attempts to generate business.
Society, through its government, provides an 'economic safety net' for when a person loses his independent source of income. What this 'safety net' is called changes from time to time according to political expedience. To preserve us from confusion, I shall always refer to it as State welfare. Reluctantly, therefore, I went to the Jobcentre and signed on as unemployed so that my family could receive this State welfare until I could get going again.
The amount of State welfare you receive is what the law says you need to live on, less any other money you already have coming in. In our case, this includes the Child Benefit that my wife received each week for our two dependent children. But Child Benefit is not a poor-only provision. Everybody, irrespective of their means, receives Child Benefit. Consequently, although the government counts Child Benefit as income when calculating what 'the law says you need to live on', it should be excluded when comparing what the government provides for the poor with a normal wage or salary.
NOTE: All the graphs in this chapter were formerly produced by an embedded Java applet, and were thus interactive. Unfortunately, since all mainstream browsers have now withdrawn support for embedded Java applets, this applet will no longer function. The present graph images are screen-shots from the original Family Finances program written in 'C', which you may download and run alongside your web browser as a very helpful companion to reading chapters 5, 6 and 7 of this book.
The following chart shows my family's total income and its components from when I started my first full-time job in 1966 to the present (2000). The gargantuan downturn in our income in Spring 1991 is clearly visible.

I did not record Child Benefit before 1991. It is therefore only included as part of our income after Spring 1991. See my income table for the detailed figures from which this chart was generated. NOTE: All charts in this chapter are
inflation-corrected.
It became immediately and painfully obvious that a government of the kind elected by a self-seeking employed majority, cared nothing for families who were being thrown out of their jobs and their homes and ruined through circumstances not of their making. Prior to becoming unemployed, I was as guilty as all who listened to the rumours as to how well the lazy layabout unemployed lived on benefits at my expense as a virtuous hardworking taxpayer. I was therefore wholly unprepared for the miserly sum that my family and I were suddenly forced to live on.
On the other hand, our spending had a certain inertia. It could not be so drastically curtailed so instantly. I had a car on hire purchase. I had needed this car for business travel. I had to make a large capital payment in order to complete the contract. And there were a thousand and one other commitments that could not be gracefully chopped with the instancy needed to stay in line with our reduced income. Our normal day-to-day spending habits were those of a family that had to maintain a life-style that was compatible with that of our social and professional peers. These habits had to be broken, which inevitably led to a complete loss of professional and social contact.
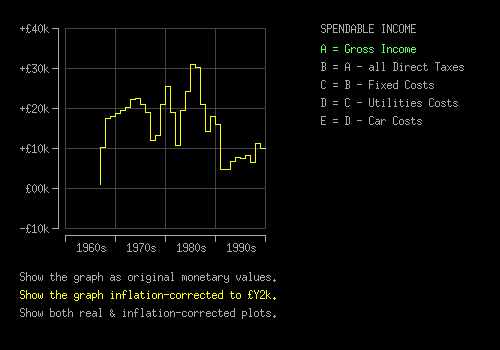
The following chart shows our spendable income over the years of my business and unemployment from 1976 to 2000. See the main table for the figures from which this chart was generated. Spendable income is the amount left to spend after fixed costs and the costs of domestic utilities have been subtracted from net income. The financial inertia that caused our spending unavoidably to overshoot our income is clearly visible in the negative excursion during the financial year 1991-92.
Dispassionate market forces thus plunged us into poverty almost overnight. Time and endeavour had shown that seeking work was not going to solve our income problem. We would simply have to learn quickly how to survive on State welfare. To do so, we had to reduce expenditure quickly to a level we had never before encountered. I knew that if we were to survive as a family, sweeping changes would have to be made to the way our domestic economy was managed.
I decided to muster the best of my engineering and systems analytical skills to try to work out how best to reduce our quality of life steadily and non-destructively to a level we could afford on State welfare. This stringently managed 'graceful degradation' of my family's quality of life was expedited in three phases of increasing severity as follows.
First we eliminated all functions that were not immediately vital to the sustaining of life or the fulfilling of official obligations.
Next we cut out waste and increased efficiency in all the remaining activities, processes and functions within the home.
Finally, we scaled down the activity level of all the vital functions to their lowest levels of sustainable operation.
We suspended all plans for extending or adding to our home. I closed my business account and returned my credit cards without debt. Meals out, holidays and all non-vital travel were banned. Christmas would have become a complete non-entity, had we not received presents and a little help from certain relatives. We restricted our consumption of food, clothing, gas and electricity. I fixed the house, repaired domestic appliances and serviced the car myself. Use of the telephone was restricted to vital calls only. Everywhere the belt was tightened until it could be tightened no more.
My total direct taxation for the years of my business and my unemployment from 1976 to 2000 is shown below. See the taxation table for the figures from which this chart was generated.

As can be seen from the chart, once I became unemployed, quite rightly, my taxation dropped abruptly to zero. Except, that is for water rates, which are shown by the lone green trace extending resolutely beyond 1990-91 when I became unemployed.
Water is charged at a rate that is unrelated to the amount of water we use. Hence, by definition, it is a tax. Furthermore, the amount we have to pay is completely outside our control or influence. It is supposedly based on the market value that our house was deemed to have had on a certain statutorily-decided date. This amount is wholly unrelated to our ability to pay. It could at any time be increased without constraint. Unlike with council tax, there is no benefit to counter water rates for the unemployed.
I also consider the television licence fee to be a form of direct taxation that is unrelated to one's income or ability to pay. The water rates and the television licence fee are fixed amounts. If one is going to have water (a basic need of life) and also some form of contact with society (another basic need of life) then these two things cannot be subject to any forms of reduction for the sake of the family budget.
There are also other things in one's domestic economy that are totally inflexible when it comes to economising. These are the mortgage and insurances on one's home.
My mortgage and insurance costs over the years I was in business and unemployment between 1976 and 2000 are shown in the following chart. See fixed costs table for the figures from which this chart was generated.

My mortgage finished in 1993. Two years later I was forced by hardship to terminate the insurance policies on my house and its contents. One may think this rash. But a burglar can only steel things from the house. He cannot steel the house. Fire can burn the house down. It cannot take the freehold of the land on which we could somehow still live. We would not be able to build a house. Nevertheless, we could borrow a caravan and park it on our land until the local authority threw us off. Then we could sell the land and live on the capital.
This is a small risk compared, for instance, with putting one's house up as surety for a business loan. I did this throughout the 1980's as surety for my business overdraft with the bank. That money was entirely for financing the credit gap with my corporate customers. Had any of them gone bust or somehow refused or become unable to pay me, then I would have had to forfeit my house to the bank. A business is far more likely to fail than a house is to burn down. A business failure could easily have resulted in my loss of the entire property — house, land and all.
Of course, in today's world of global capitalism, this kind of risk-taking is considered virtuous. However, there is a world of difference between a sole trader risking his house on the success or failure of his business, and a capitalist rashly gambling the lives and livelihoods of the middling many while cowering anonymously behind his bastion of limited liability. Economic risk at the fractal level of the individual and the family is quite a different phenomenon from risk at the corporate and macroeconomic level.
The bottom line, as far as these fixed costs were concerned, was that I could do nothing about them until the mortgage reached its natural termination in 1993. Even then I could not economise on insurances: I could only elect to keep them going or terminate them completely. In the tight circumstances, I had only one humane choice: I had to terminate them so we could eat.
A sector of domestic costs that would seem to lend itself more readily to economic control would seem to be the utilities, namely:
- Gas used for heating the rooms and for hot water,
- Electricity used for all other energy needs in the home,
- Telephone: our only practical means of interactive social contact.
The spending on utilities over the years of my business and unemployment from 1976 to 2000 are shown in the following chart. See utilities table for the figures from which this chart was generated.
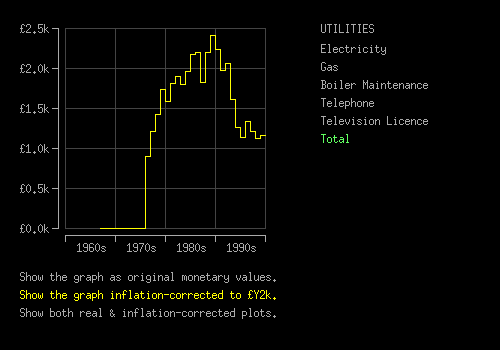
Society has cut off the natural alternatives to buying these utilities. Wood gathering is no longer legal and besides, our house has no fireplace. The capital cost of alternative technology is prohibitive, and obstructive planning laws render it wholly impractical. We therefore did the only thing we could: use less. I think the steep downward trend in spending on all utilities — especially with the telephone — from 1991 when I became unemployed is witness to just how hard we tried.
We had a service contract on our gas boiler. Each year, a technician came to our house, stripped down the entire boiler, cleaned the burner, reassembled it and readjusted it. The cost of this service is shown on the chart. In 1996, a new young technician came. He did not strip the boiler and clean the burner as usual. He said that all they did now was inspect it. Yet the price of the service contract was the same (when inflation-corrected, of course). When the next demand for the annual payment for the contract came, I decided that I simply could not afford it.
Of course, gas appliances can become very dangerous if they are not properly and regularly serviced. Nevertheless, faced with the food budget we were eventually left with, terminating the gas servicing contract was — even so — by far the lesser evil. One simply has to accept that poverty is not simply hard; it is downright dangerous.
We have a car. Its primary use was for business travel, although it was — and is still — essential for shopping trips and other necessary journeys. Despite its burdensome cost, the car is something we cannot do without if we are to remain economically functional. Our only option was to reduce car expenditure to an absolute minimum. Our success in this is evinced by the following petrol expenditure chart.
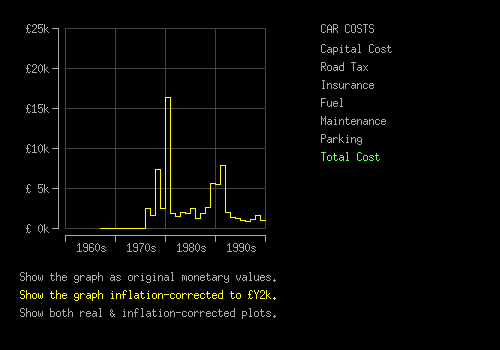
As can be seen, petrol cost — and hence mileage — is now less than a quarter of what it was while I was running my business and is only half what it was before I started my business.
What we now spend on car travel is less than half what it would cost one person to make the same journeys by public transport. Personally, I hate driving. I would far rather travel by train or coach.
In my efforts to find work, I decided to attend a trade conference in Birmingham. To be able to get there in time, my only option was the train. The return fare was £70 for one person. I put £10 worth of petrol in my car and went. Some of that £10 worth of petrol was still in my tank when I got back home. The car park in Birmingham cost me £1. That is a seventh the price for one person to go by train and one thirty-fifth of the price had my wife, daughter and two sons come as well.
For all practical purposes, love it or hate it, the car is the only option for personal mobility outside major cities under today's socio-economic infrastructure.
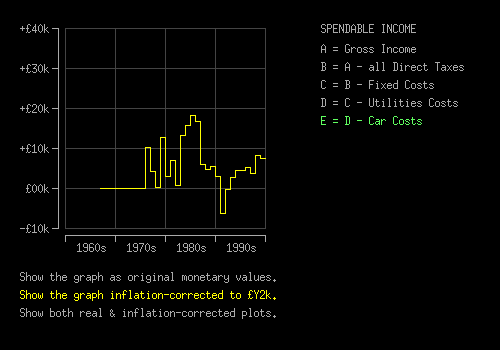
Having economised as far as is technically possible by terminating 'unnecessary' fixed costs, squeezing the use of utilities and minimising car travel, what is left to live on? What is left for the basic needs of life — food and clothing? What then remains for the other mandatory expenses that this First World Western society surreptitiously imposes upon the individual? The answer, for our family as a whole, is shown in the following chart.
See main table for the figures from which this chart was generated.
Just in case some should declare our car to be a luxury that we ought to do without in the circumstances, I have plotted what we have left to live on both before (Button D) and after the deduction of car costs (Button E). Car costs had very little effect between 1976 and 1991. This is because our family income was relatively high then, and also because a large proportion of the capital and maintenance costs were paid for as business expenses.
The extreme negative excursion of the 'with car costs subtracted' curve in 1991 is due to a final capital payment. Had my business continued, a large proportion of this would have been written off by the business. However, on becoming unemployed, I could no longer do this and was forced to pay it out of personal savings. Nevertheless, it should be noted that, in 1991, even without this capital payment being taken into account, the 'with car costs subtracted' curve would still have grazed the zero line.
We had absolutely nothing left out of our State welfare with which to eat, wash and clothe ourselves. We survived this initial effect of our household's economic inertia by exhausting our remaining capital. Without this we would have starved.
At the other end of the scale, it seems that things got a lot better in 1998. Be not deceived. This is only because my wife — after over 30 years of illness — was finally awarded what is called Disability Living Allowance. It is ironic that this was at a time when she had never been so well. Her being in receipt of DLA automatically resulted in an increase in Jobseeker's Allowance for me. This is the reason for the 1998 upturn. However, my wife's DLA has to be re-applied for, and re-assessed, after two years. She may not get it again, in which case, our income will be back to its 1993-94 level.
In June 1999, my elder son reached the age of 19. This meant that we lost Child Benefit for him and also the component of my Jobseeker's Allowance for his support. He is a special needs pupil and had to stay on at school after he was 19. He is supposed to have the right to free education until he is 25 instead of the normal 19. However, with his means of support withdrawn, this 'right' is pointless. Consequently, from the end of June 1999, four of us had to live on the amount of welfare provided for 3. This is a situation that those who make the rules probably failed to think of.
So much for what we had available to spend. But what did we actually spend? To answer this I shall present a detailed analysis of what we actually spent in the year 1993-94. This was the first year, after being switched suddenly from a normal income to the miserly means of State welfare, that we managed to stabilise our domestic economy. For this reason, I take it as a representative year of existence on State welfare for our family.
Naturally, it includes the basics of food and clothing. But running a home in a modern economic environment incurs other mandatory costs. Things do not last for ever. They wear out and need replacing. The house, its fabric, systems, appliances and furnishings have to be maintained. There are also other expenses that people are increasingly expected to meet out of their own pockets that were once provided to all in full by the State.
These include the cost of schooling. Though State education may be free in name, it is a lot less free than it was when I went to school. The school may 'provide' books. But only some of them. The 'preferred' books and equipment have to be bought. Parents also have to finance expensive field trips. One of my sons was expected to go on a field trip to Russia as part of his A-level history course. Those who could not go were a very small minority who afterwards lacked the context for class discussion in subsequent studies.
I also thought it expedient to maintain my membership of my professional institutes. I had to terminate two, but initially kept a third one going.
Finally, I decided that if I were going to remain up-to-date and active in my skills for developing computer software, I would have to maintain a working and up-to-date personal computer. To this end, I allocated money towards the cost of a new one for when the one I 'inherited' from my business failed or became too obsolete to use.
What we actually spent is shown in the following table. The heading '£Y2K' shows the 1993 amounts inflation-corrected to the 2000 value of the £, ie what the costs would have been if they had been incurred in 2000. This budget could have sustained our family at a basic level of subsistence indefinitely. I therefore called it our Survival Budget. But as can be seen, it meant that we spent 152% over our income in the year 1993-94.
| Family Survival Budget |
1993 |
£Y2K |
Type |
| Computer (tool of my trade) |
£300.00 |
£360.55 |
budget |
| Institute Membership |
£80.00 |
£96.15 |
fixed |
| School costs |
£479.68 |
£576.50 |
fixed
|
| Milk 730 pints @ .38p |
£277.40 |
£333.39 |
squeezed |
| Food & Consumables |
£2990.49 |
£3594.11 |
squeezed |
| Clothes & Linen |
£402.94 |
£484.27 |
squeezed |
| Maintenance & Replacement |
£1700.00 |
£2043.14 |
budget |
| Total |
£6230.51 |
£7488.11 |
| Money Available (accounts for car costs) |
£2475.50 |
£2975.17 |
| Surplus (Available - Total) |
−£3775.01 |
−£4512.94 |
| Percentage (+ is surplus, − is overspend) |
−152% |
−152% |
There was no choice. I had to eliminate all those 'necessities' that did not contribute immediately to life-support. I therefore cut out provision for updating and replacing my computer, my final professional institute membership, and the entire domestic maintenance & replacement budget. This reduced our family budget as follows:
| Degradation Budget |
1993 |
£Y2K |
Type |
| School costs |
£479.68 |
£576.50 |
fixed |
| Milk 730 pints @ .38p |
£277.40 |
£333.39 |
squeezed |
| Food & Consumables |
£2990.49 |
£3594.11 |
squeezed |
| Clothes & Linen |
£402.94 |
£484.27 |
squeezed |
| Total |
£4150.51 |
£4988.27 |
| Money Available (accounts for car costs) |
£2475.50 |
£2975.17 |
| Surplus (Available - Total) |
−£1,675.01 |
−£2013.10 |
| Percentage (+ is surplus, − is overspend) |
−68% |
−68% |
This budget made no provision for the maintenance and replacement of the home, its systems, appliances and furnishings. They would gradually degrade and wear out. I therefore called this budget our Degradation Budget. Even this had a 68% overspend. Our surplus of income over expenditure(SI), had we followed either of these two budgets, is shown in the following chart.
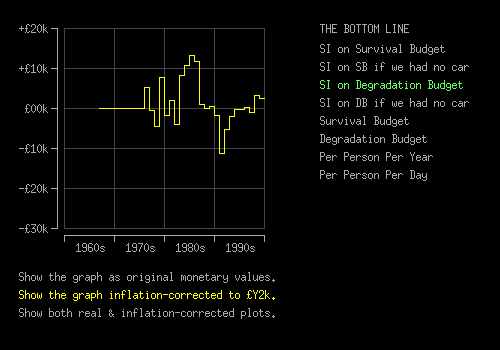
See surplus table for details.
Clearly, if we keep our car, neither budget is sustainable. Not, that is, without my wife's Disability Living Allowance, which started in 1998. Neither is the Survival Budget, even without the cost of the car. The Degradation Budget, without the car, is the only case that is remotely sustainable on State welfare without my wife's Disability Living Allowance. Over my entire period of unemployment, the Degradation Budget without car costs would have averaged an overspend of £426.28 per year. During 1995-96 — the middle of the most stable portion of the curve — it has an under-spend (or surplus) of £139.21. But beware, that is only 9½ pence per person per day.
The Final Squeeze
But we were still 68% over budget with no other source of income. There was only one place left to squeeze. That was our expenditure on food and clothing. With two growing boys to feed, this was dangerous. But there was no other option. We decided to eliminate the clothing allowance altogether. We lived in hope that wealthier relatives would buy us clothes as presents. They did. But we had to slash the food allowance to balance the budget. The budget we finally ended up with is shown in the following table. Under the heading 'pppd' is the equivalent amount per person per day. Under the heading 'ic-pppd' is the corresponding amount expressed in £Y2K.
| Deprivation Budget |
1993 |
£Y2K |
Type |
pppd |
ic-pppd |
Percent |
| School costs |
£479.68 |
£576.50 |
fixed |
£0.33 |
£0.39 |
19% |
| Food & Consumables |
£1,718.42 |
£2,065.28 |
squeezed |
£1.18 |
£1.41 |
69% |
| Milk |
£277.40 |
£333.39 |
squeezed |
£0.19 |
£0.23 |
11% |
| Total Costs |
£2,475.50 |
£2,975.17 |
|
£1.69 |
£2.04 |
100% |
| Total Available |
£2,475.50 |
£2,975.17 |
| Surplus |
£0.00 |
£0.00 |
| Percentage |
0% |
0% |
Perhaps a more poignant depiction of the miserly means State welfare leaves us to live on is its representation as an amount per person per day for each member of our family. This is shown in the chart below.
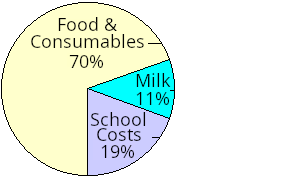
The surplus of income over expenditure did rise slightly in subsequent years as shown on the chart. Nevertheless, it was only slight, and the downward perturbation in 1997 shows that the budget given in the above pie chart was the only level of spending that was sustainable in the long-term. Besides, some money was needed for other things.
The question now was, without savings constantly to draw on, how did we manage to sustain life on this amount of money at prices encountered in a yuppie commuter town within London's extended hinterland? All we had to do was calculate a tolerable diet that could provide our basic 1,716 kilocalories of carbohydrate, 1,098 kilocalories of fats and 348 kilocalories of protein for £1.69 (£2.75 Y2K values) per person per day from our local supermarket whose products and prices are geared to a customer base of rich yuppie commuters in Southeast England.
An Austere Life Style
It must be noted that this budget excludes and ignores most of the things that most people take for granted and do not even think about as costs. This budget makes provision for:
- no rail or bus fares for searching for work
- no paper, envelopes stamps etc for applying for jobs
- no entertainment other than watching television
- no holidays, no hobbies, no sports, no treats, no presents
- no meals out in restaurants or cafés
- no holidays or trips to the coast
- no extra-curricular activities for our sons
- no driving lessons to better equip them to get jobs when the time comes
- no help for our daughter with her costs at university
- no travel other than essential journeys by car — eg shopping
- no pension, life insurance, house insurance or contents insurance
- no gas boiler maintenance — a dangerous situation
- no replacement of things that wear out — appliances, carpets, lawnmower etc.
- no re-decorating or house repairs
- no contingency for emergencies of any kind
In fact, it includes only what has been specifically mentioned in the budget itself. Any of the above would have to be squeezed out of the £1.69 (in 1994) per person per day (£2.75 in Y2K value). It must also be remembered that it makes provision only for the very basics necessary to maintain only the vital functionality of the family and home at its lowest level of sustainable operation. And that furthermore, it is only sustainable in the short-term. There is no repair, maintenance and replacement budget.
The 'per person per day' figure did improve after 1993 as shown in the following graph.
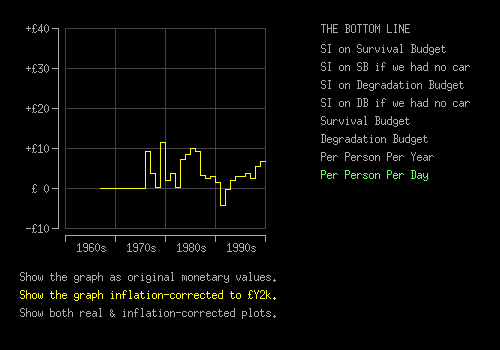
However, this is only because we have not had any of the inevitable emergencies yet, our mortgage came to an end, and our ageing car and gas boiler kept going. The steep rise in 1998 and 1999 is due almost entirely to my wife becoming 'eligible' for Disability Living Allowance. But this is all on borrowed time. When the car wears out, the gas boiler blows and my wife is deemed to be no longer in need of DLA, then we will be back on the 1993 budget equivalent to £2.04 (Year 2000 value of the £) per person per day. When our sons eventually leave home we will be left to exist on far less.
Conclusion
In the Time of Plenty, all I had to do was work. Wealth followed. Now, in this Time of Dearth, my work yields nothing. Our only source of income is a meagre government hand-out called State welfare. To survive on this, and avoid the total catastrophic collapse of our domestic economy, it was necessary to plan and stringently manage a graceful degradation of our home and quality of life. To achieve this, we first eliminated all the non-essential functions and activities. We then cut out all waste and boosted the efficiency of all the essential functions of our home. Finally, we tightened the belt until each remaining function was operating at its minimum sustainable level.
But we still could not make ends meet. We had to eliminate our maintenance budget also. The vital functions of our home thus became totally unprotected against accident, appliance failure or fabric deterioration. These once-routine occurrences have become crises from which there could be no recovery. Spending has become entirely event driven. Money is spent, from giro to giro, on whatever is most pressing at the time. Budgeting is, in reality, pointless and meaningless. The slightest financial perturbation could be lethal. An unforeseen cost could eliminate our food budget instantly. This delicate balance cannot last. Sooner or later we will be forced to start amputating vital functions from our family economy. It seems inevitable that the first of these will be our ageing car, thus losing our ability to travel beyond walking distance from our home.
Graceful Degradation is reversible. Once the national economy re-awakened from recession, we would still have had all the functionality necessary to re-connect with it and rebuild our quality of life to its former state. However, having had to eliminate all contingencies has meant that the longer we remain in this state, the worse our state will become.
Functional Amputation, on the other hand, is not reversible. Without one or more of our home's essential functions — in our case the ability to travel — we will no longer have the means to take advantage of future opportunities that may emerge as the national economy recovers. I will therefore never be in a position again to 'earn' the money to replace the means of travelling to where these opportunities to 'earn' this money may present themselves.
As things stand, it seems that the present miserly level of State welfare, reluctantly provided by a government that reflects the attitude of its dispassionate electorate, is set to make the economic collapse of our home inevitable. We cannot eat and clothe ourselves properly on £1.69 per person per day (£2.75 at Y2K value). I don't believe anyone can. And I have a growing sense that a large raft of people in this country are simply not going to tolerate this silent sneaky covert form of inhumanity for very much longer. British society has plenty of all the needs and luxuries of life. For it to arbitrarily subject a minority within its midst to these miserable conditions of life is an inexcusable disgrace, which is beyond redemption.
If all this were not reprehensible enough, there is more. Since the summer of 1999, there have been times when the 4 of us have had to live on the amount of benefit officially designated for 3. And for 6 weeks in the summer of 2001, 3 of us had to live on the benefit of 2. Please do not think that just because 'the law says' you need a certain minimum amount to live on that you are necessarily going to receive that amount always. Do not assume also that because you should be officially exempt from having to pay medical prescription and dental charges that you are not going to end up paying them in full without reimbursement. And your welfare payments can be arbitrarily stopped at any time because of the way some socially irresponsible flibbertigibbet in the Benefits Agency decides to interpret one or more of their silly rules. Make no mistake, the spectre of destitution is always a real and present danger for those in need.
Addendum January 2014: Since I updated this chapter in April 2003, I remained unemployed until I left the UK in 2004 for a better and more respected life in another country. I retired in 2007. I am now 71.
PREV |
NEXT | ©July 1994, April 2000 Robert John Morton
