About my interest in:
Chaos Theory
Introduction
Difference Equation
Bifurcation Maps
Mandelbrot Set
Hénon's Attractor
Iterative Function
Lissajous Figures
Program: chaos.c
In its "spot value" plotting mode the Difference Equation Applet plots the spot values of x for the first 70 or so iterations across the time graph. Then, having reached the end of the time axis, it flies back to the left again and continues plotting x across the time axis again and again. However, there you can only see the envelope for the one value of c being used at the time, namely the one shown in the 'adjust c' field.
The applet above, on the other hand, laboriously plots the envelopes within which x wanders for a wide range of values of c. Here, though, the envelopes are each 1 pixel wide instead of 6. This applet plots the envelopes for the Standard Logistics difference equation:
x = cx(1 − x) for c = 1 to 4.
For c < 1, x can't get off the ground. This is analogous to the impossible circumstance of a species starting off from an initial population of zero or 1. For c > 4, x jumps about so chaotically that it very soon hits zero from which it can never recover. This situation is analogous to the catastrophoic demise of a species due to excessive fecundity and the resulting inadequacy of its food supply.
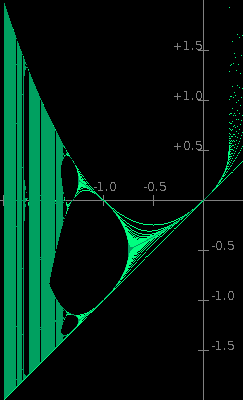
The attractor of x for each value of c is plotted in dark green. The bright green aura indicates the number of iterations needed for x to reach the attractor from its initial value. It may be thought of as the inverse of the attractor's attractive force or 'gravity'.
 The applet on the left plots an equivalent map of the envelopes for the difference equation x = x² + c. This is a real-axis only version of the equation z = z² + c used to generate the Mandelbrot set. The Mandelbrot set would lie in the horizontal plane perpendicular to the screen (probably parallel to the plane of the desk or table your PC is on). The join between the main body of the Mandelbrot bug and its head is on the c axis in line with where the first divide occurs in the attractor (at about c = −0·75). The bug's head ends and its nose begins at the point on the c axis where the attractor divides into 4 (at about c = −1·25). The 3D object which would map the complex equation z = z² + c (of which the Mandelbrot set would be its projection on to the complex plane where x = 0) would be a most intriguing mathematical apperition.
I originally wrote these programs in C.
NOTE: If with Microsoft Windows a Security box pops up saying that the application has been blocked because it's untrusted please click here. If you get warning messages with Linux, please click here.